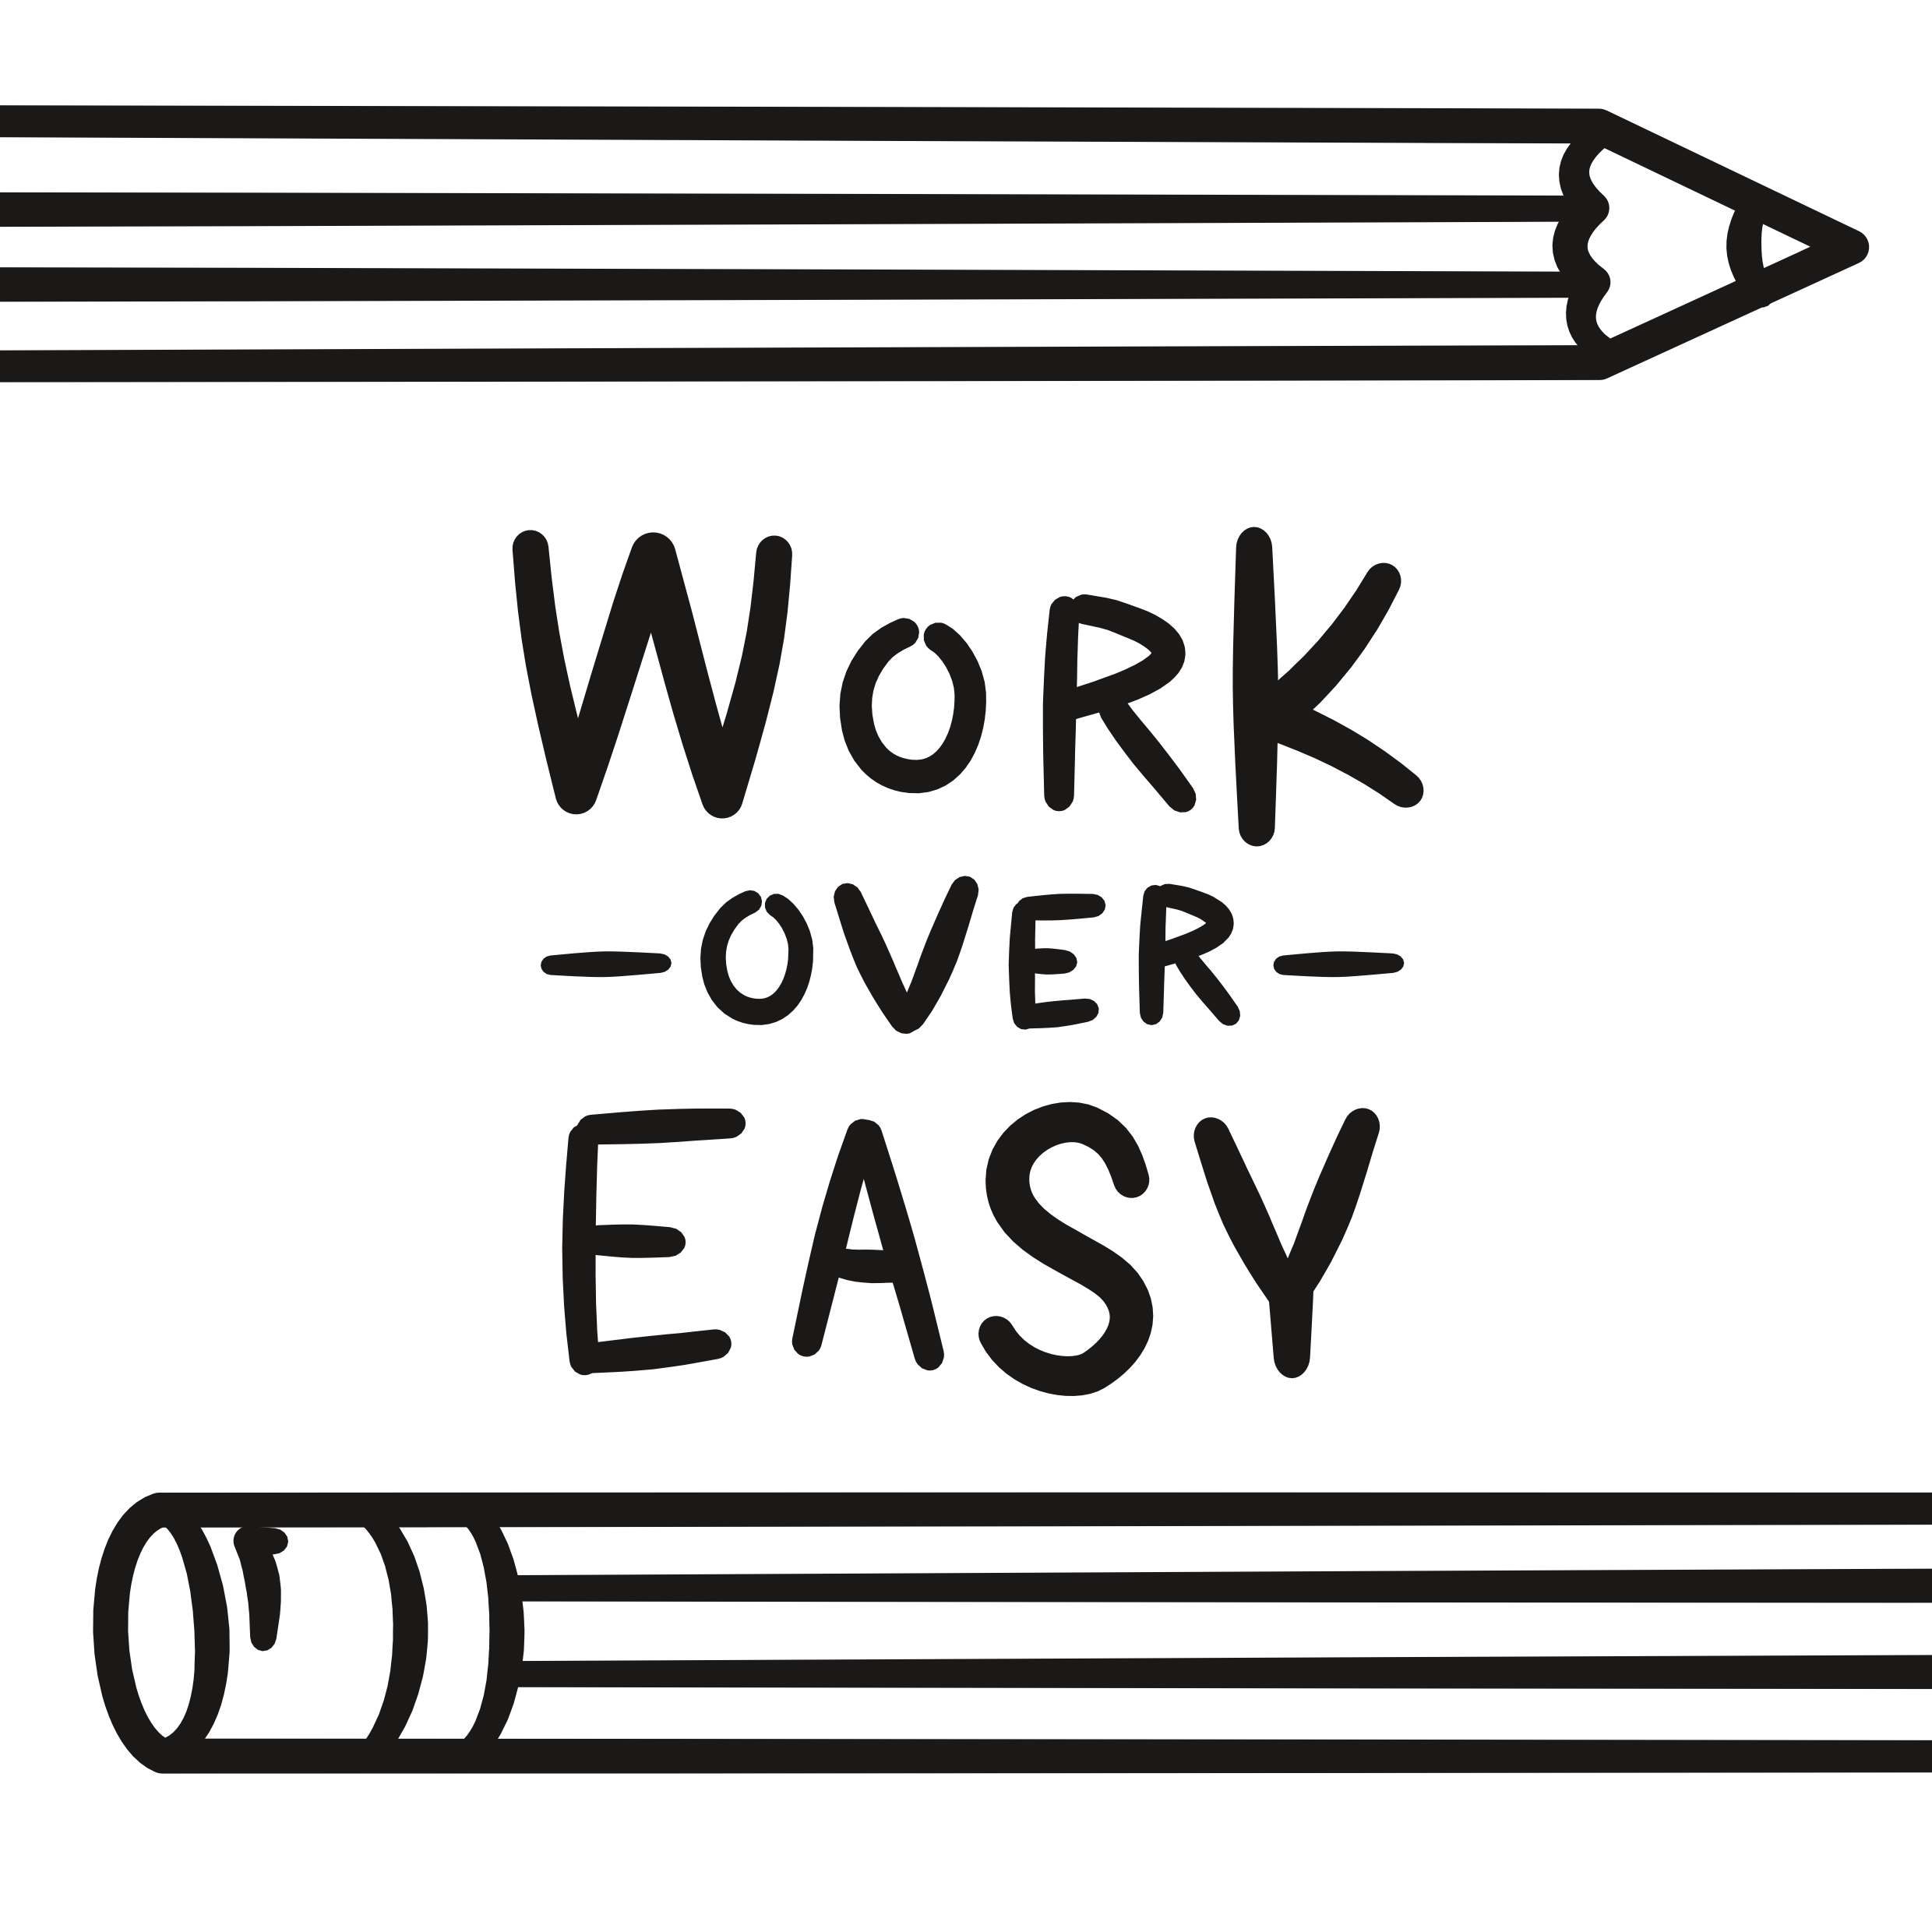
Getting to draw as part of my research work always feels like a treat. Using visuals to tell a story, gather insights and share information is my happy place.
But it’s easy to forget to bring illustration into my research practice when the common standard is to focus facilitation and documentation around written work. So, I’ve put together a non-exhaustive list of ways that research can be visual.
This list is here for me as a reminder and for anyone who works with me to inspire what you can ask for and expect from my design-led research practice.
Visual prompts in interviews
Illustrated facilitation tools are a great way to get participants engaged in interviews and workshops. These might take the form of anything from adding illustrations into card sorts, to getting participants to draw emotions as they tell you a story, to much more involved visual layouts to structure the discussion with whoever you’re speaking to.
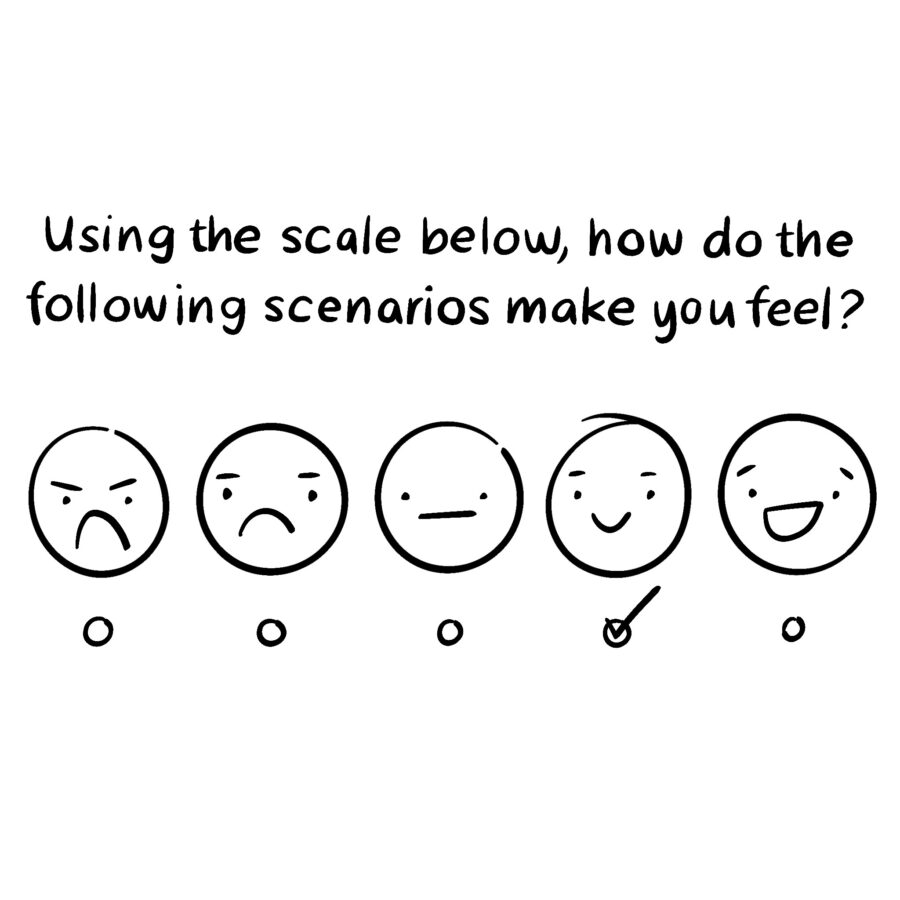
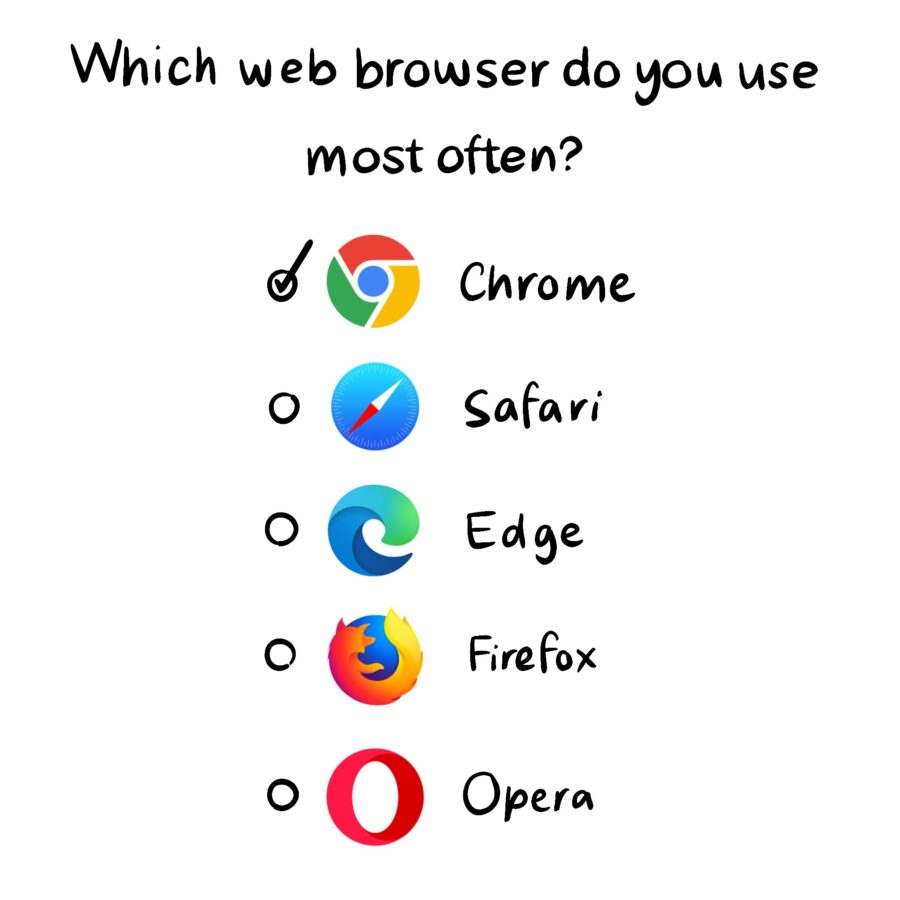
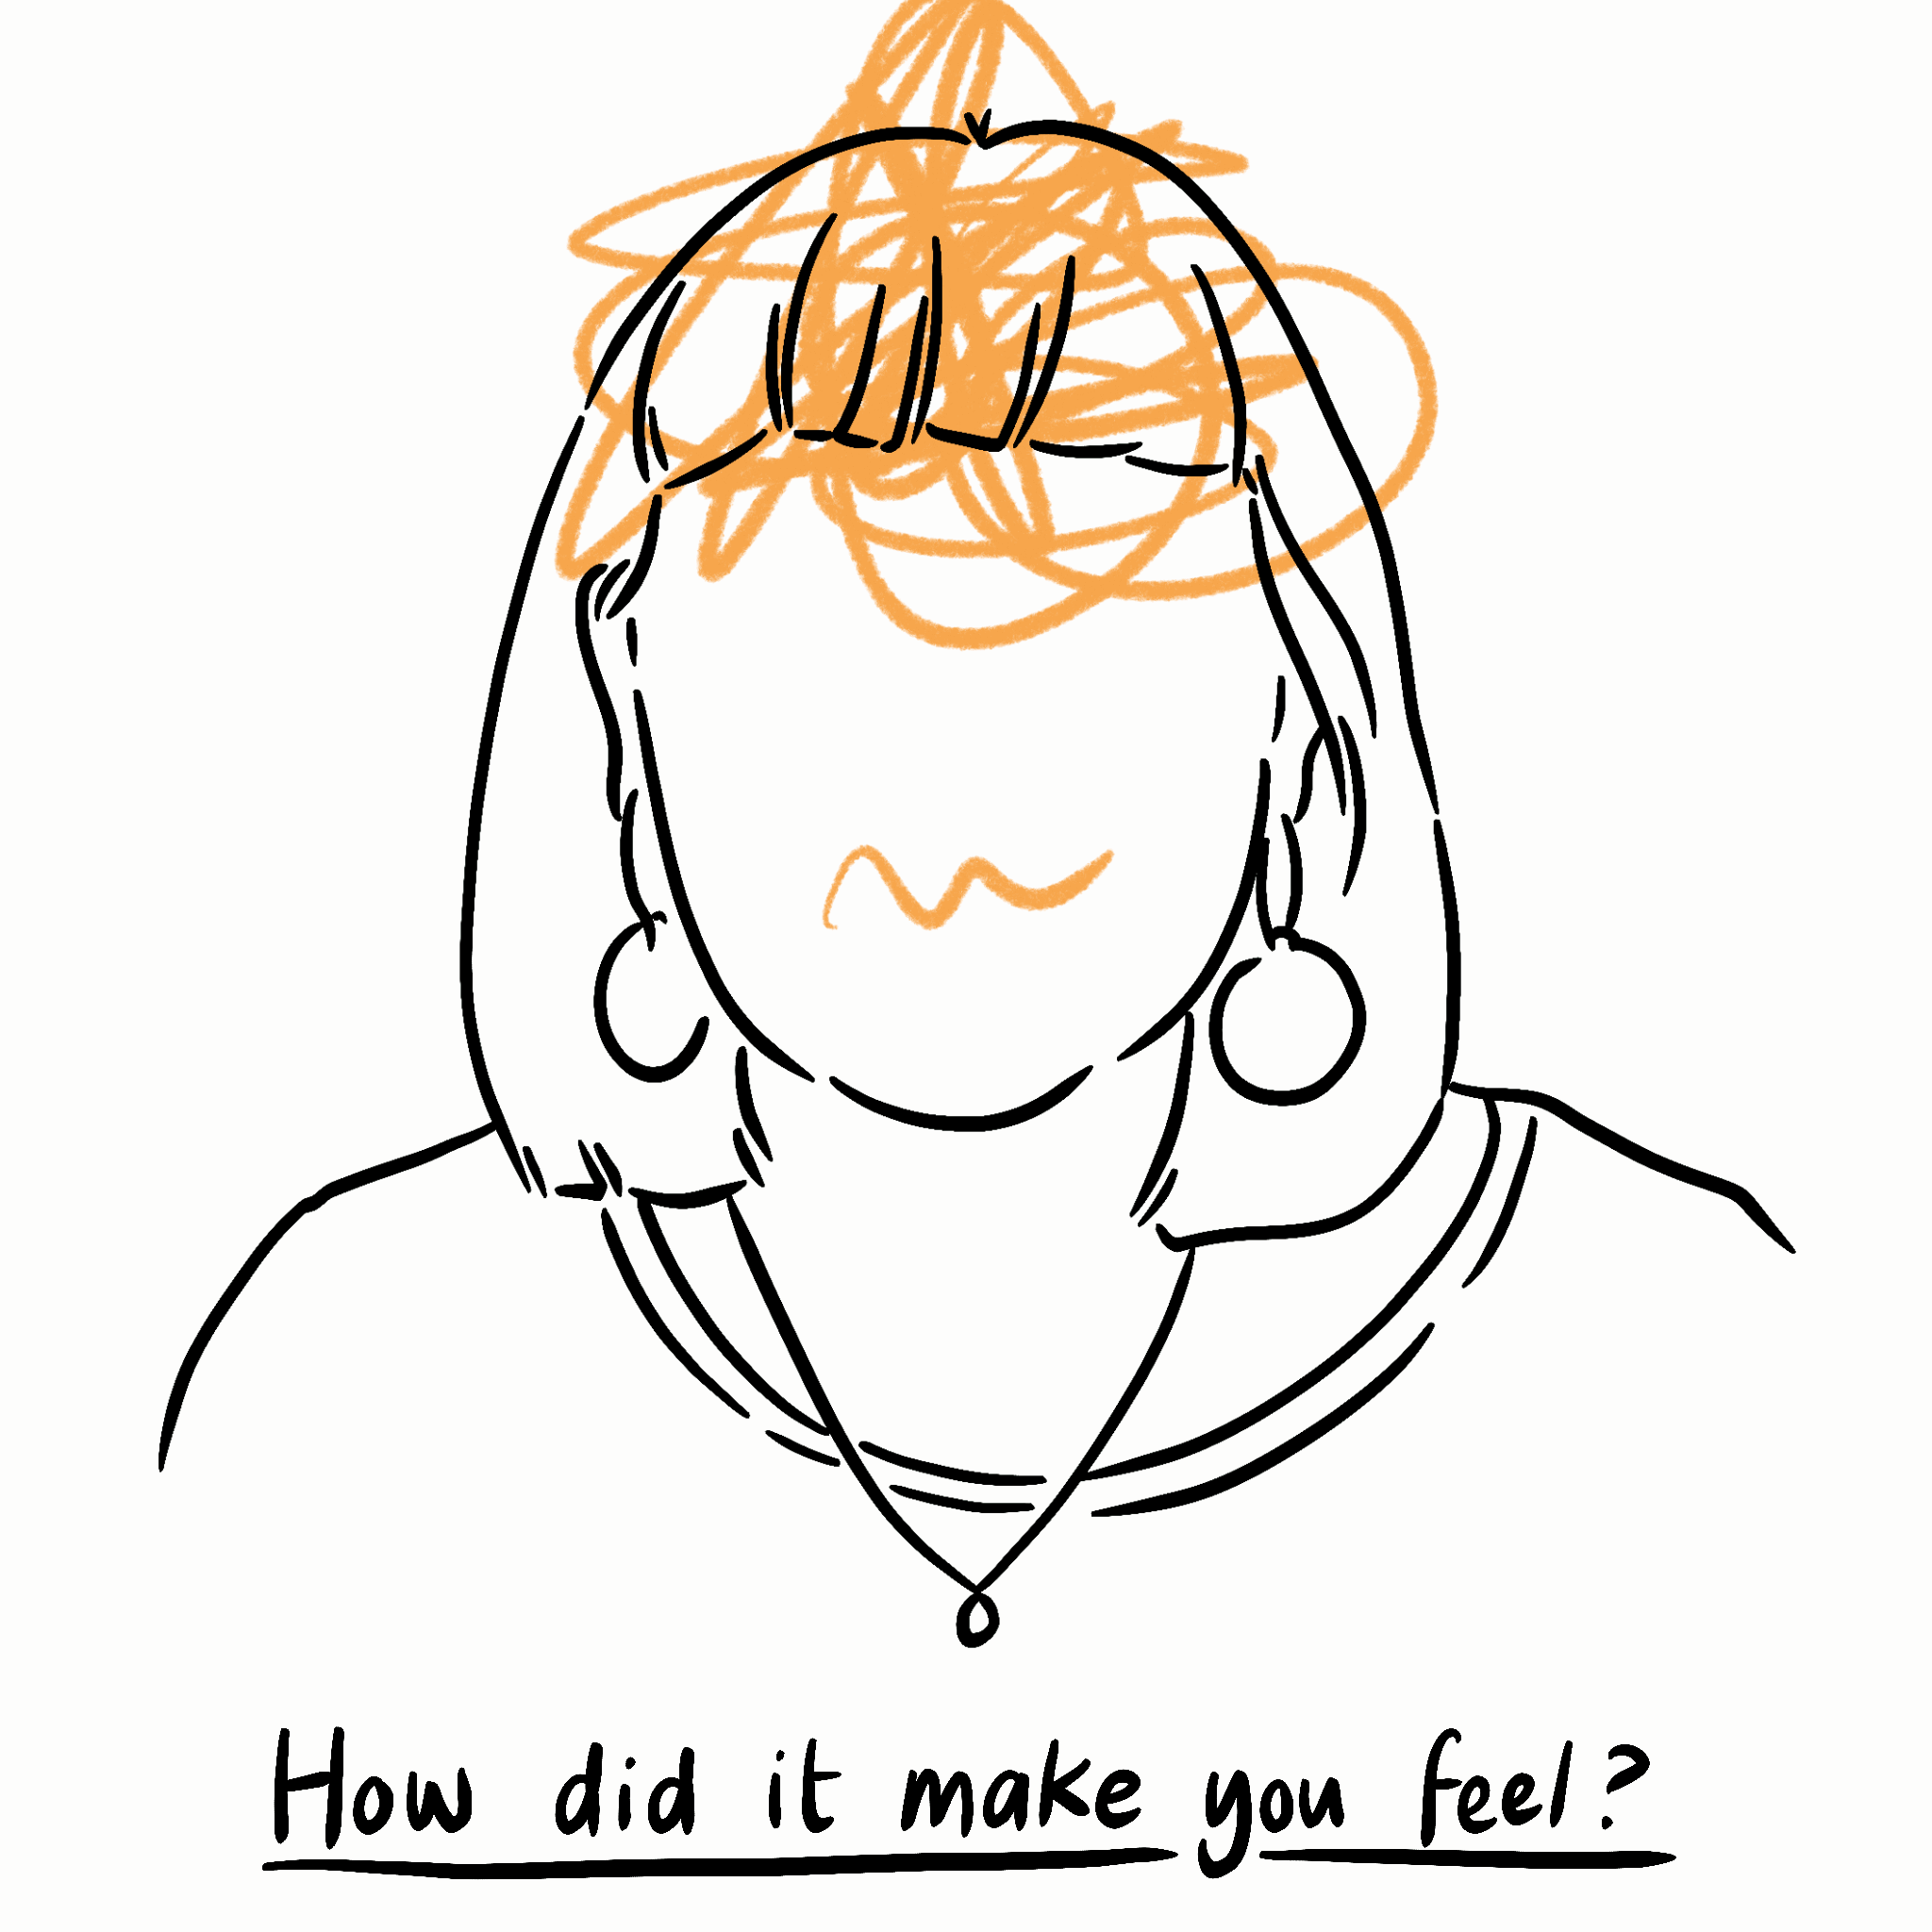
Visual elements in surveys
Surveys can be pretty dull. Including illustrations can not only make surveys more interesting to fill out, they can also inspire different kinds of responses. Visuals can bring hard to verbalise feelings and ideas to life and visual responses to questions can challenge responder’s thinking.
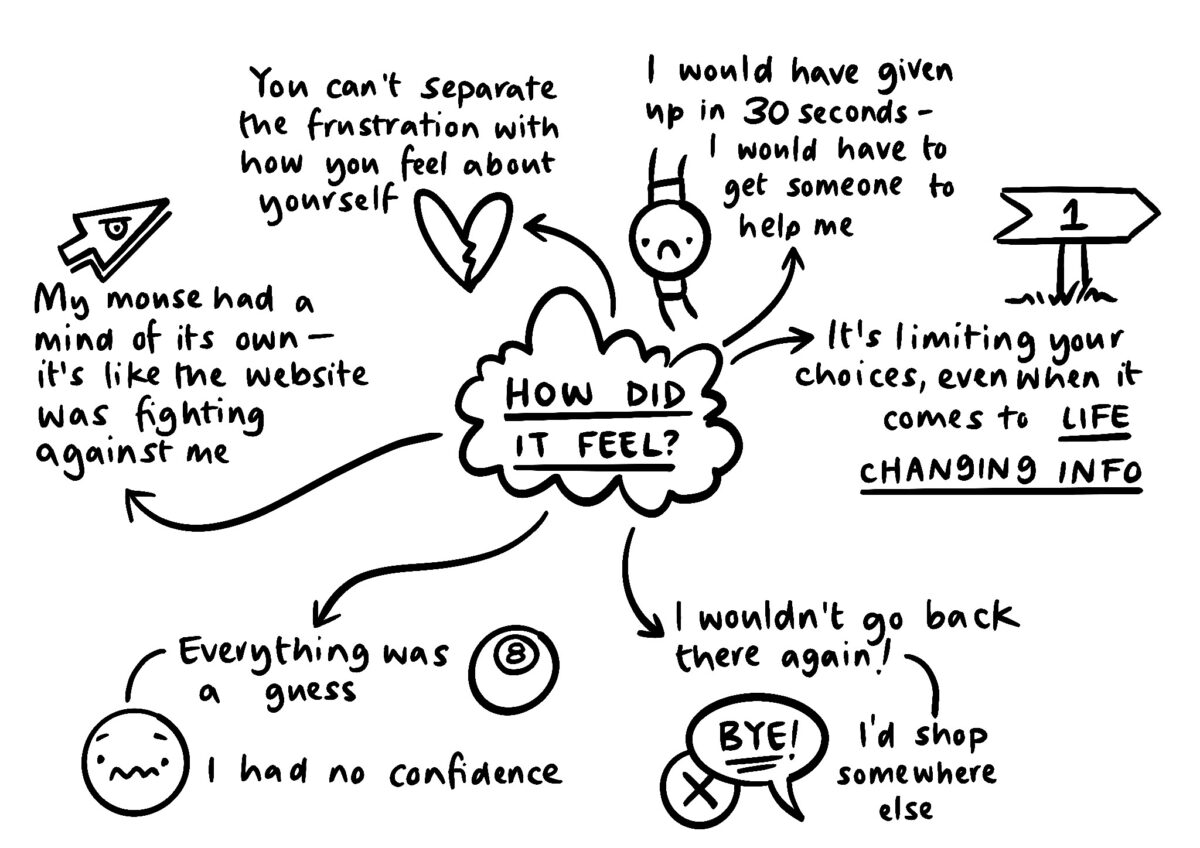
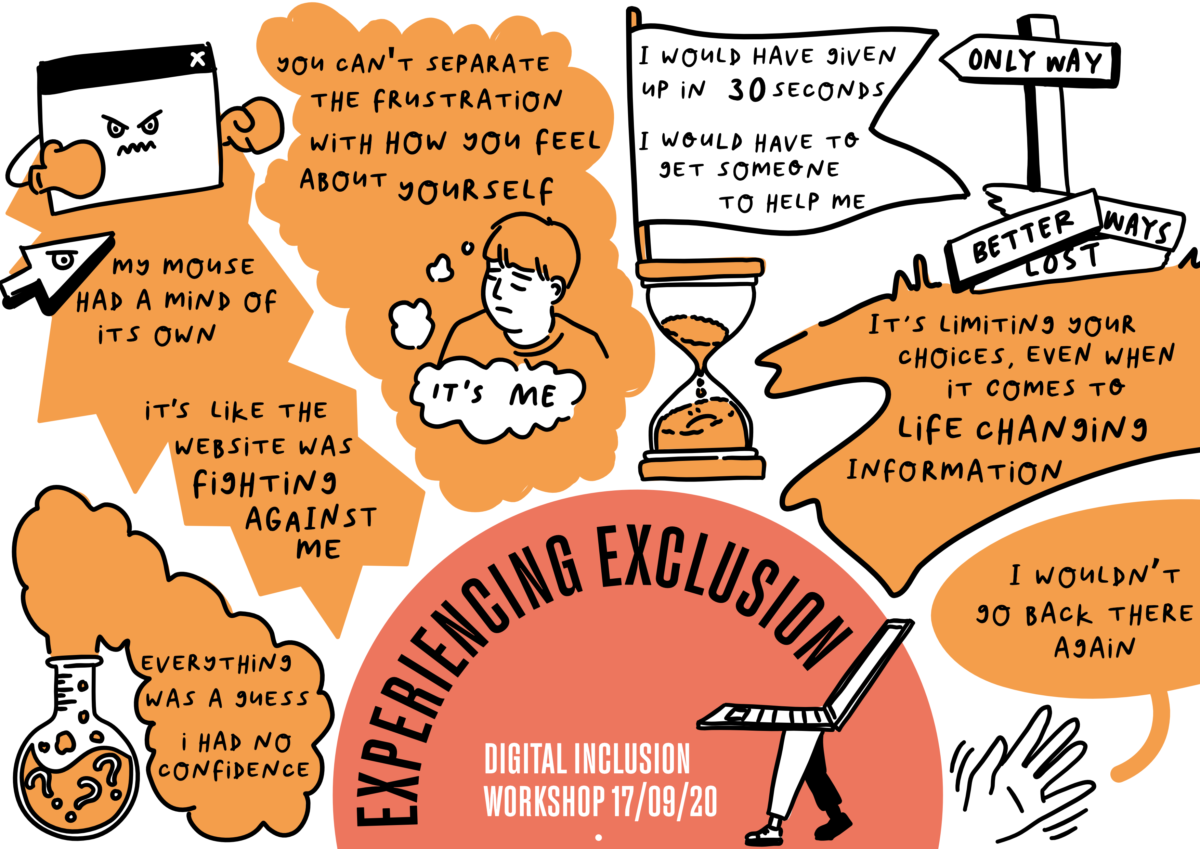
Graphic recording and facilitation
My own personal notes are filled with visual and verbal recordings, because that’s how I think best. But shared graphic recording and facilitation takes that to another level. Visuals can anchor discussions and there’s an energy that comes along with people seeing their ideas be brought together on a page not just in word form. Illustration can also be democratising in group discussions relying less on quick reading and eloquence to get a point across and see it part of the whole.
Scene sketches and multimedia reportage
Inspired by the work of brilliant artists and reporters like Olivier Kugler, illustrated scenes from research can bring back what you’ve learned through interviews and ethnography in more immersive form. These might take the form of mixed media collages, featuring photos and notes or sketches of whole scenes to bring the worlds and contexts of the people you’ve spoken to to life for everyone else involved in the project.
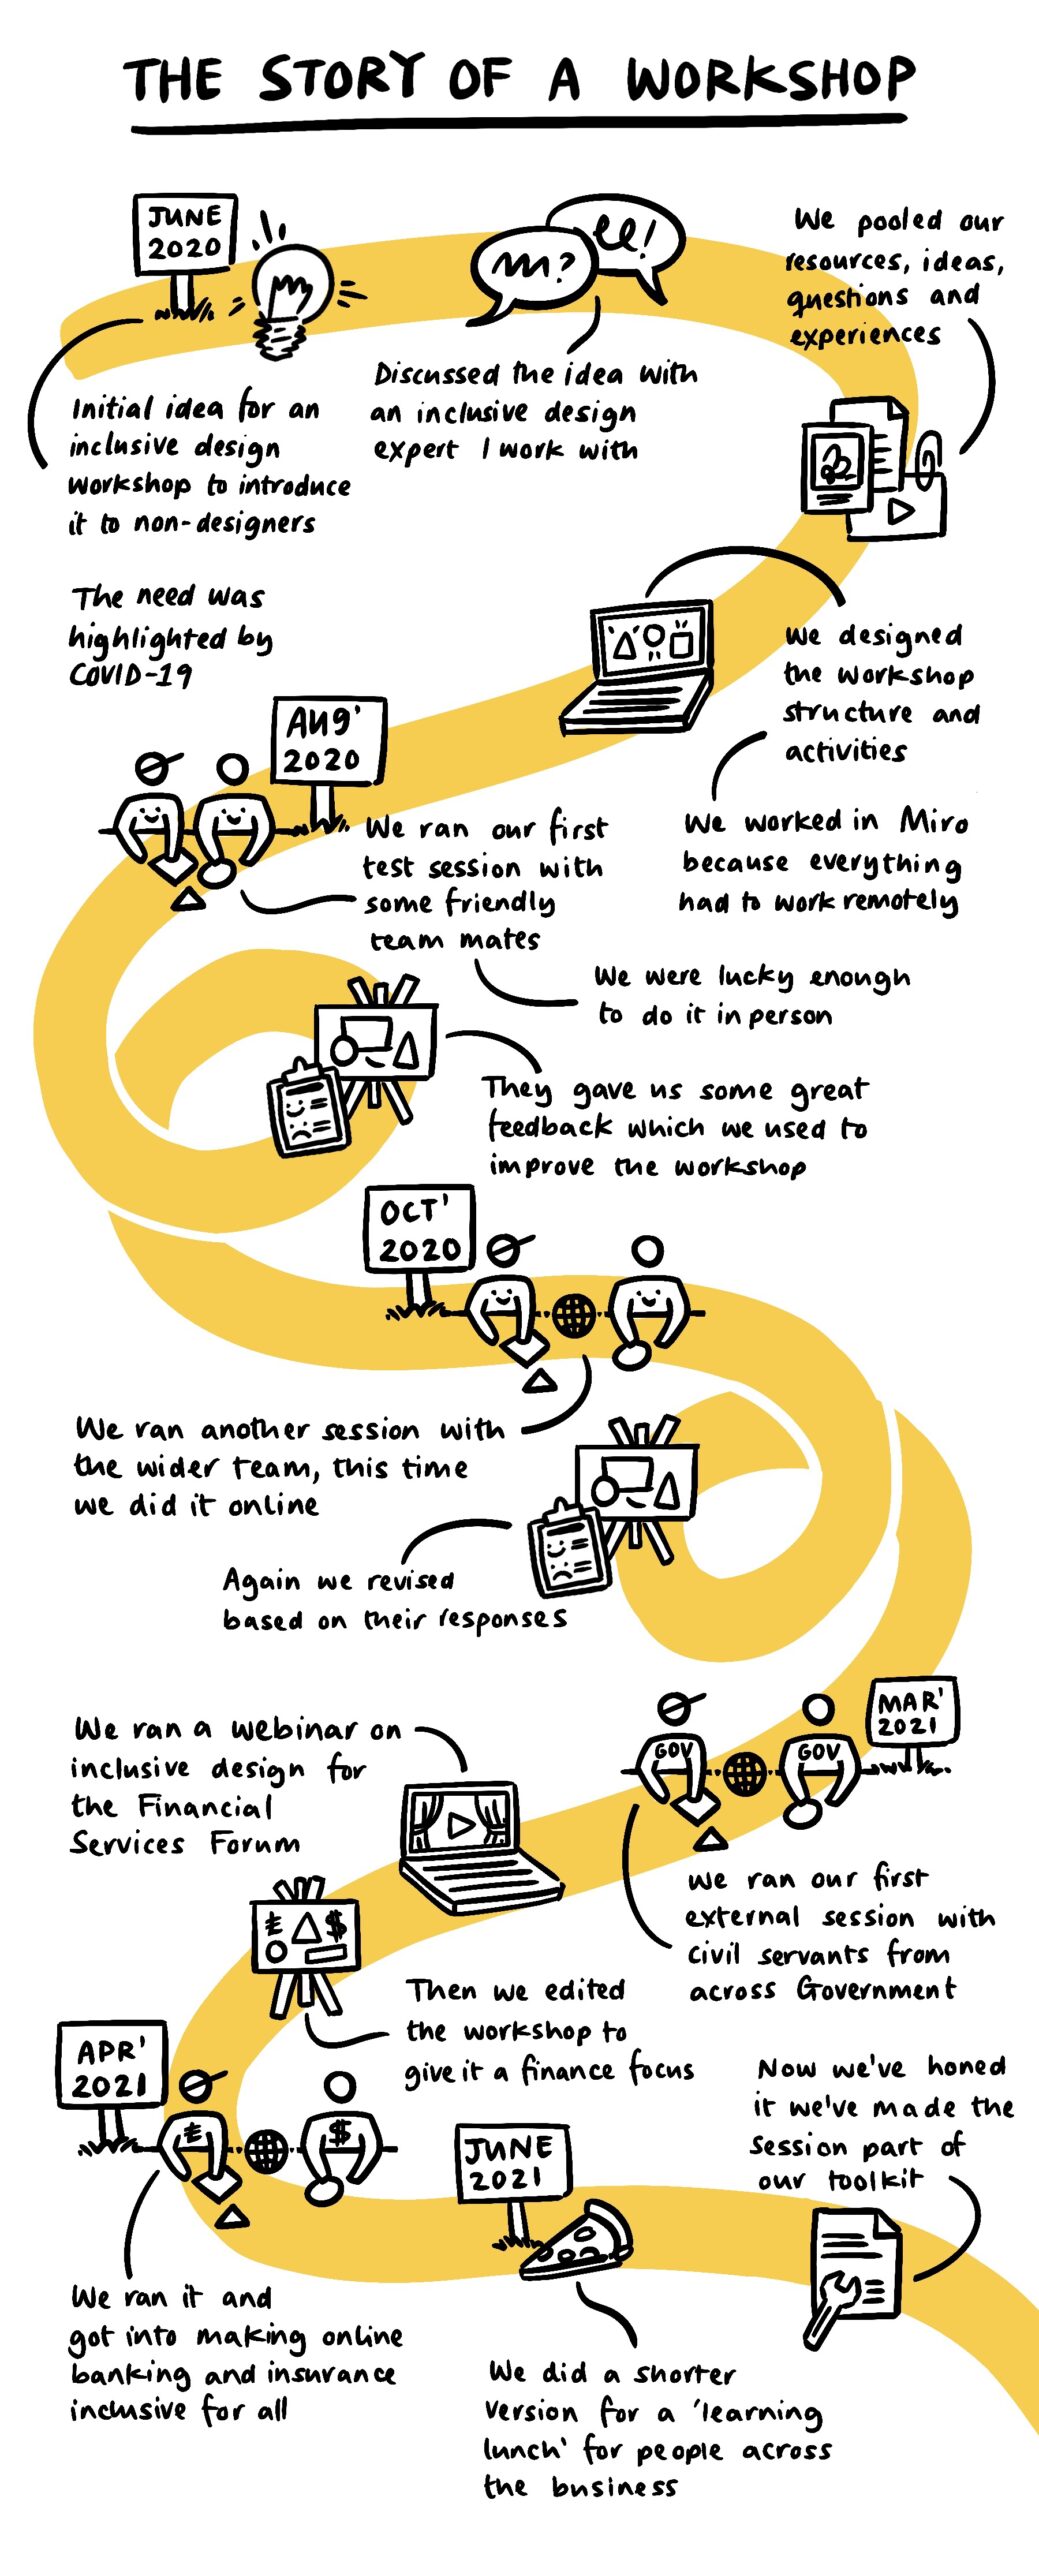
Illustrated journey mapping
Journey maps have been some of my favourite things to illustrate. Visual layouts effective hold narratives together while illustrated people, quotes and key take aways make journeys made by people through services feel human.
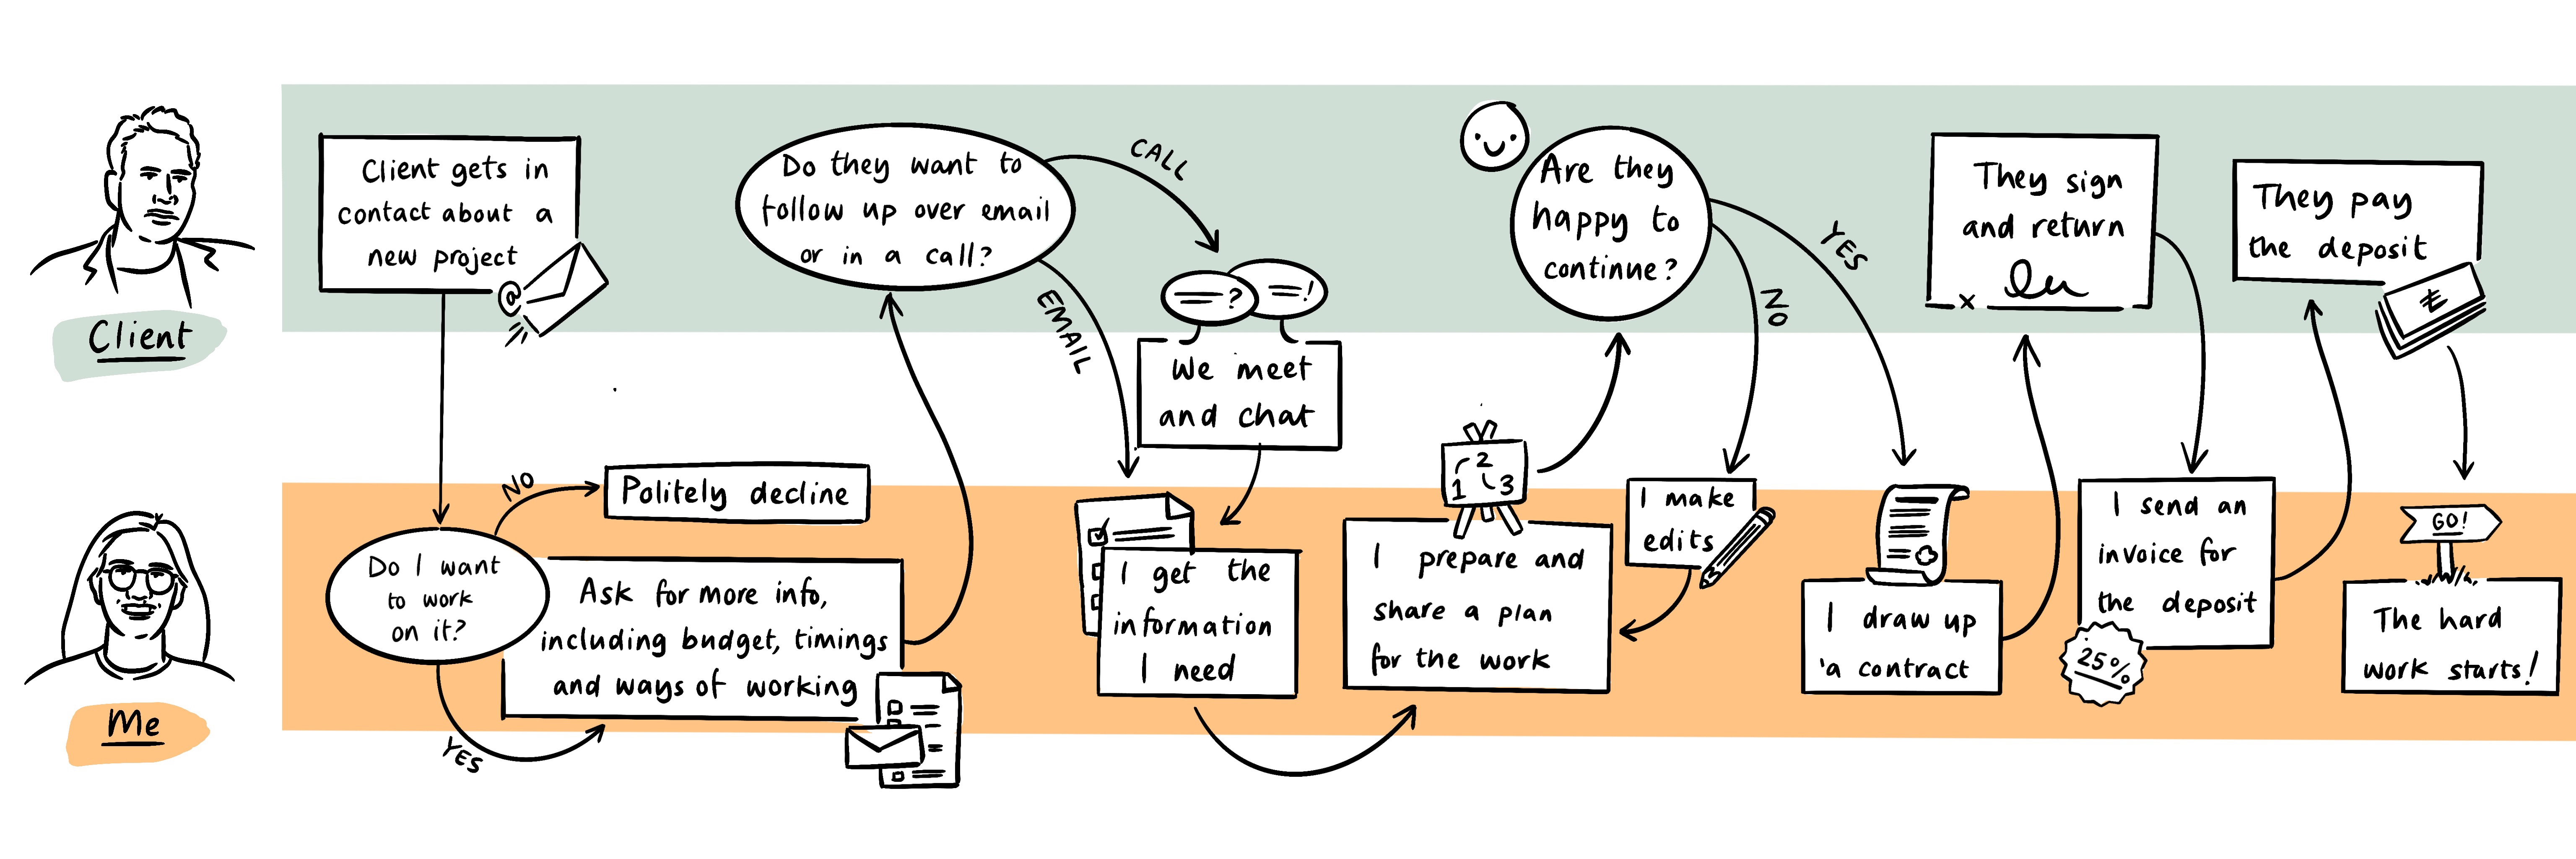
Illustrated blueprints and process diagrams
Process diagrams and blueprints are necessarily visual but they can often feel cold, bringing in illustration, even if it’s just to put faces to swimlanes can make them easier to approach and more human.
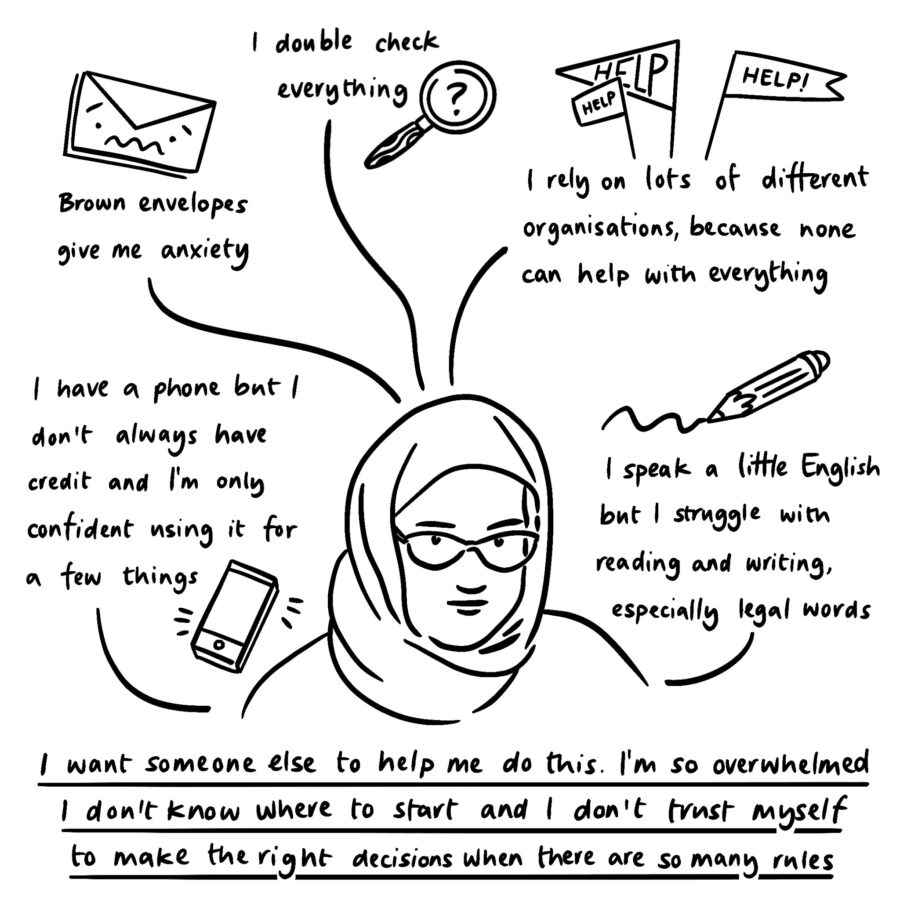
Illustrated personas
I’m a big believer that smaller more emotive personas are the most useful. Illustration is a great way to bring your key insights to life and make them easy to share and remember. Where those bigger more comprehensive character study personas are required, hand drawn elements can break them up and stop them feeling as scientific (because they very rarely are) and more human.
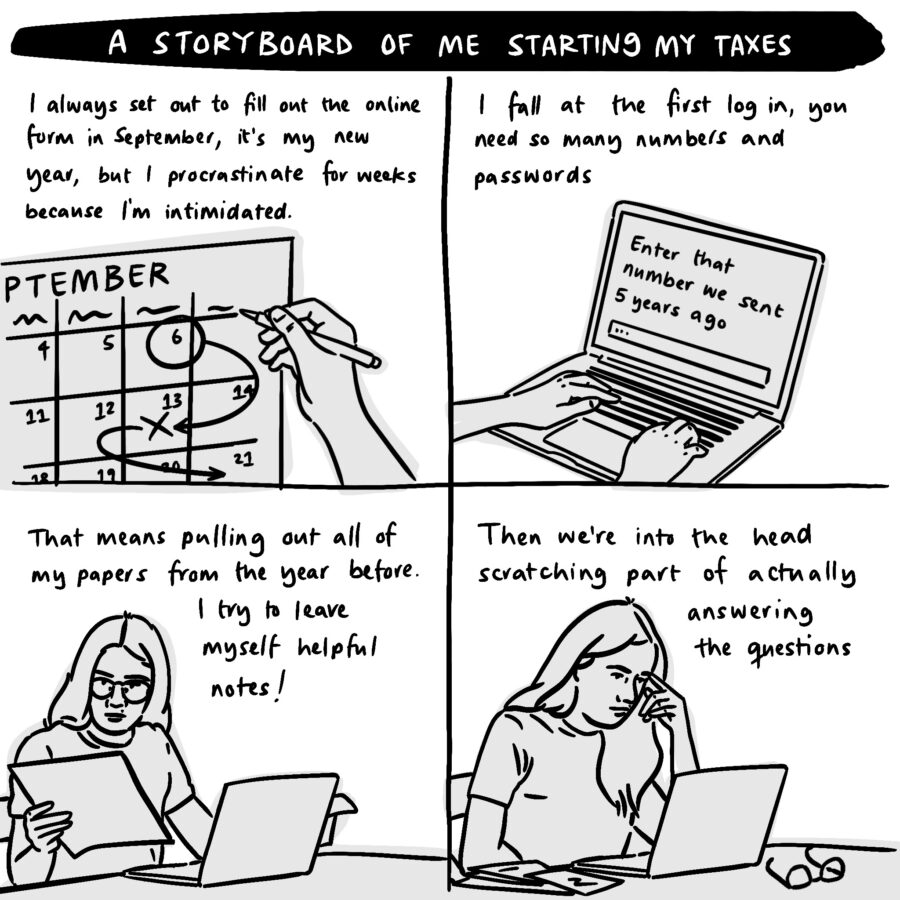
Storyboards
Storyboards are a way of visually describing a sequence of events. Their graphic format works best to tell a story of a person’s journey through a service and offer a more emotive companion to service maps and process flows.
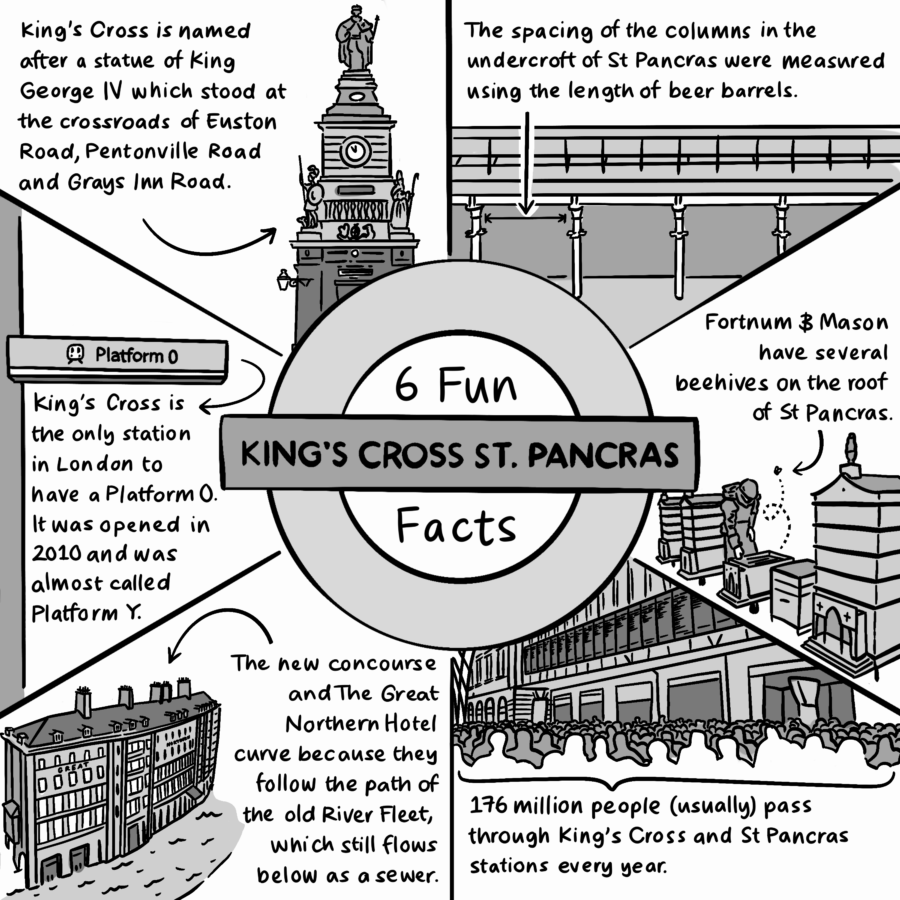
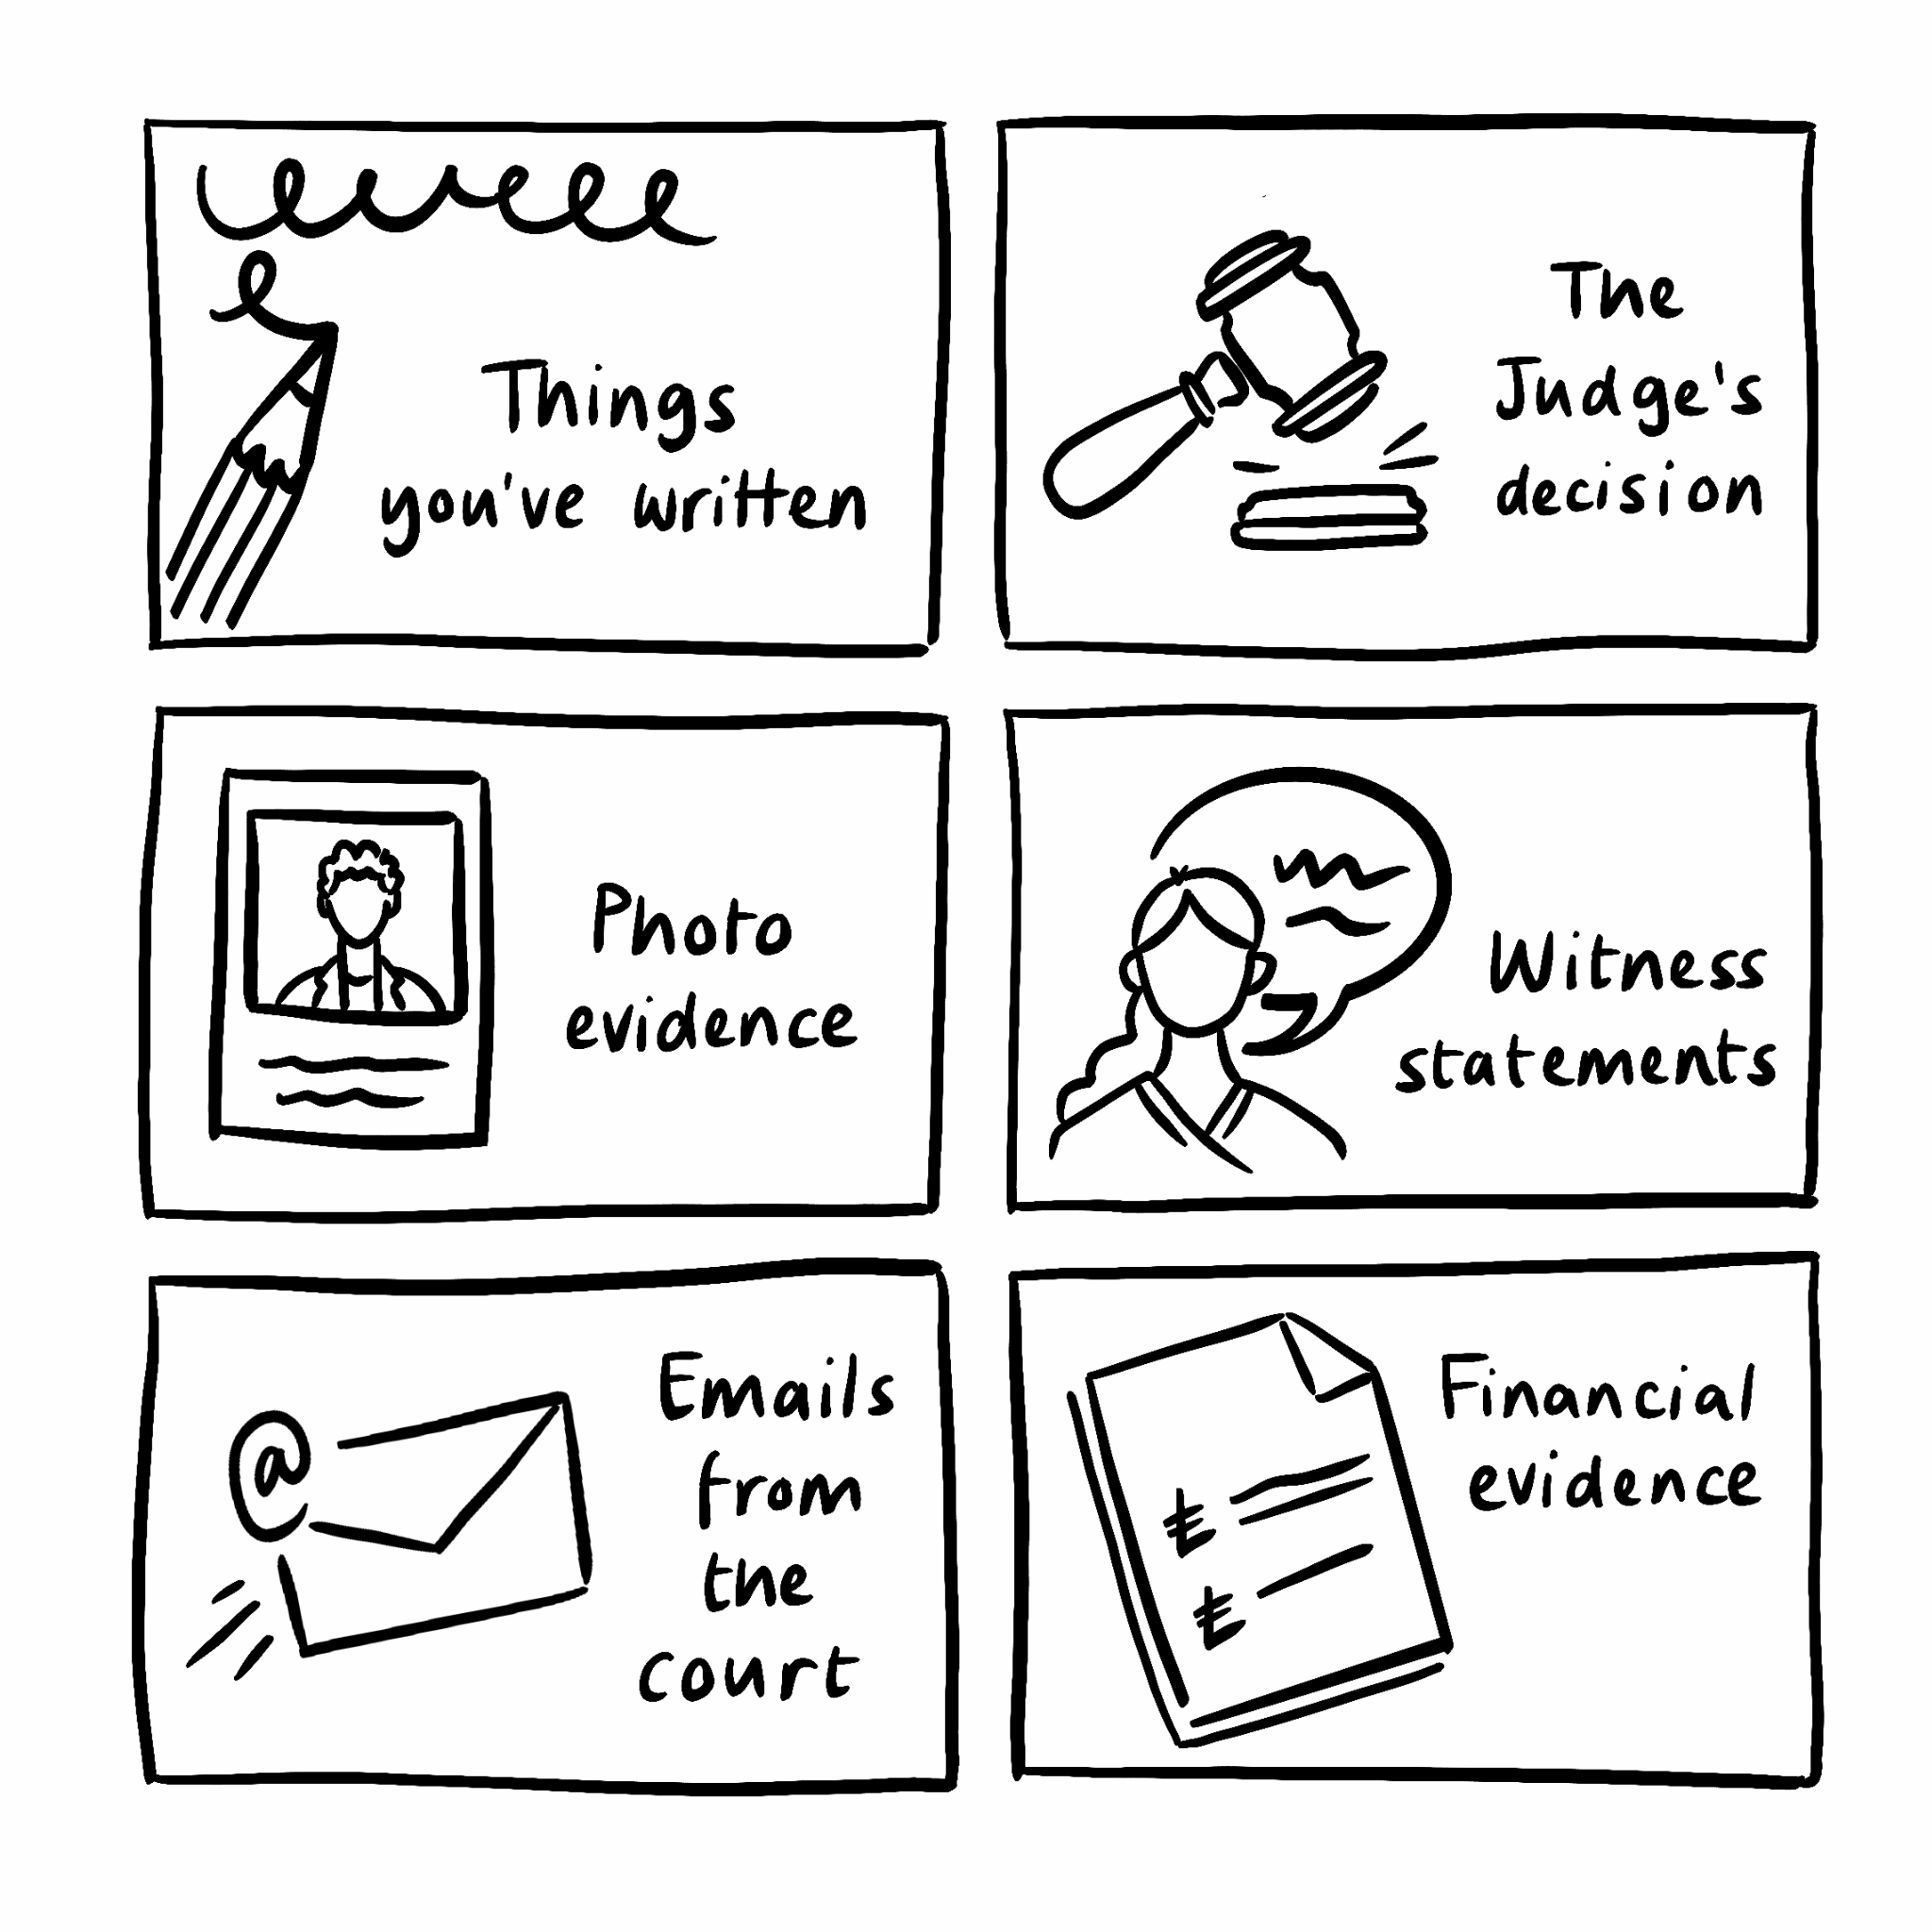
Visual cues and infographics
Sometimes research covers information that sits outside of a character or narrative format, that’s where infographics come in. At HM Courts and Tribunals Service, I did a lot of research into the different kinds of appeals, that information could be brought to life with imagery and made more accessible for stakeholders with a range of background knowledge through visual storytelling. This can work for huge bodies of knowledge, where big infographics and maps might be useful and tidbits you want to have reminders of like key quotes from people you’ve spoken to – a pepper mill drawing sat above my desk to act as a cue to remember words from one of our judges that started “consider the pepper pot…”
So those are some of the ways that my research work can be made visual and made better for being visual. Now to actually get to work and do more of this stuff!