Welcome to the 5th, and probably the last, of my birthday entries on this blog.

This will be my 450th post. I’ve created at least as many illustrations to be part of them and written hundreds of thousands of words, trying to share the things I’ve learned and loved over the years. I have no idea how much time I’ve spent making things for this space, but I can say that there have been very few moments over the last 5 years where it hasn’t been in the back of  my mind.

As I reflect on the work I’ve done, it feels like the equivalent of an adolescent growth spurt. My body of work has expanded, taken a brand new more grown up form. I’m so proud to have this body of work and that it’s carried me so far. I’m proud I have so much to refer back to, to build on, to help carry me into the next phase of my life. 

But right now it’s all arms and legs, and probably needs some time to fill out. 

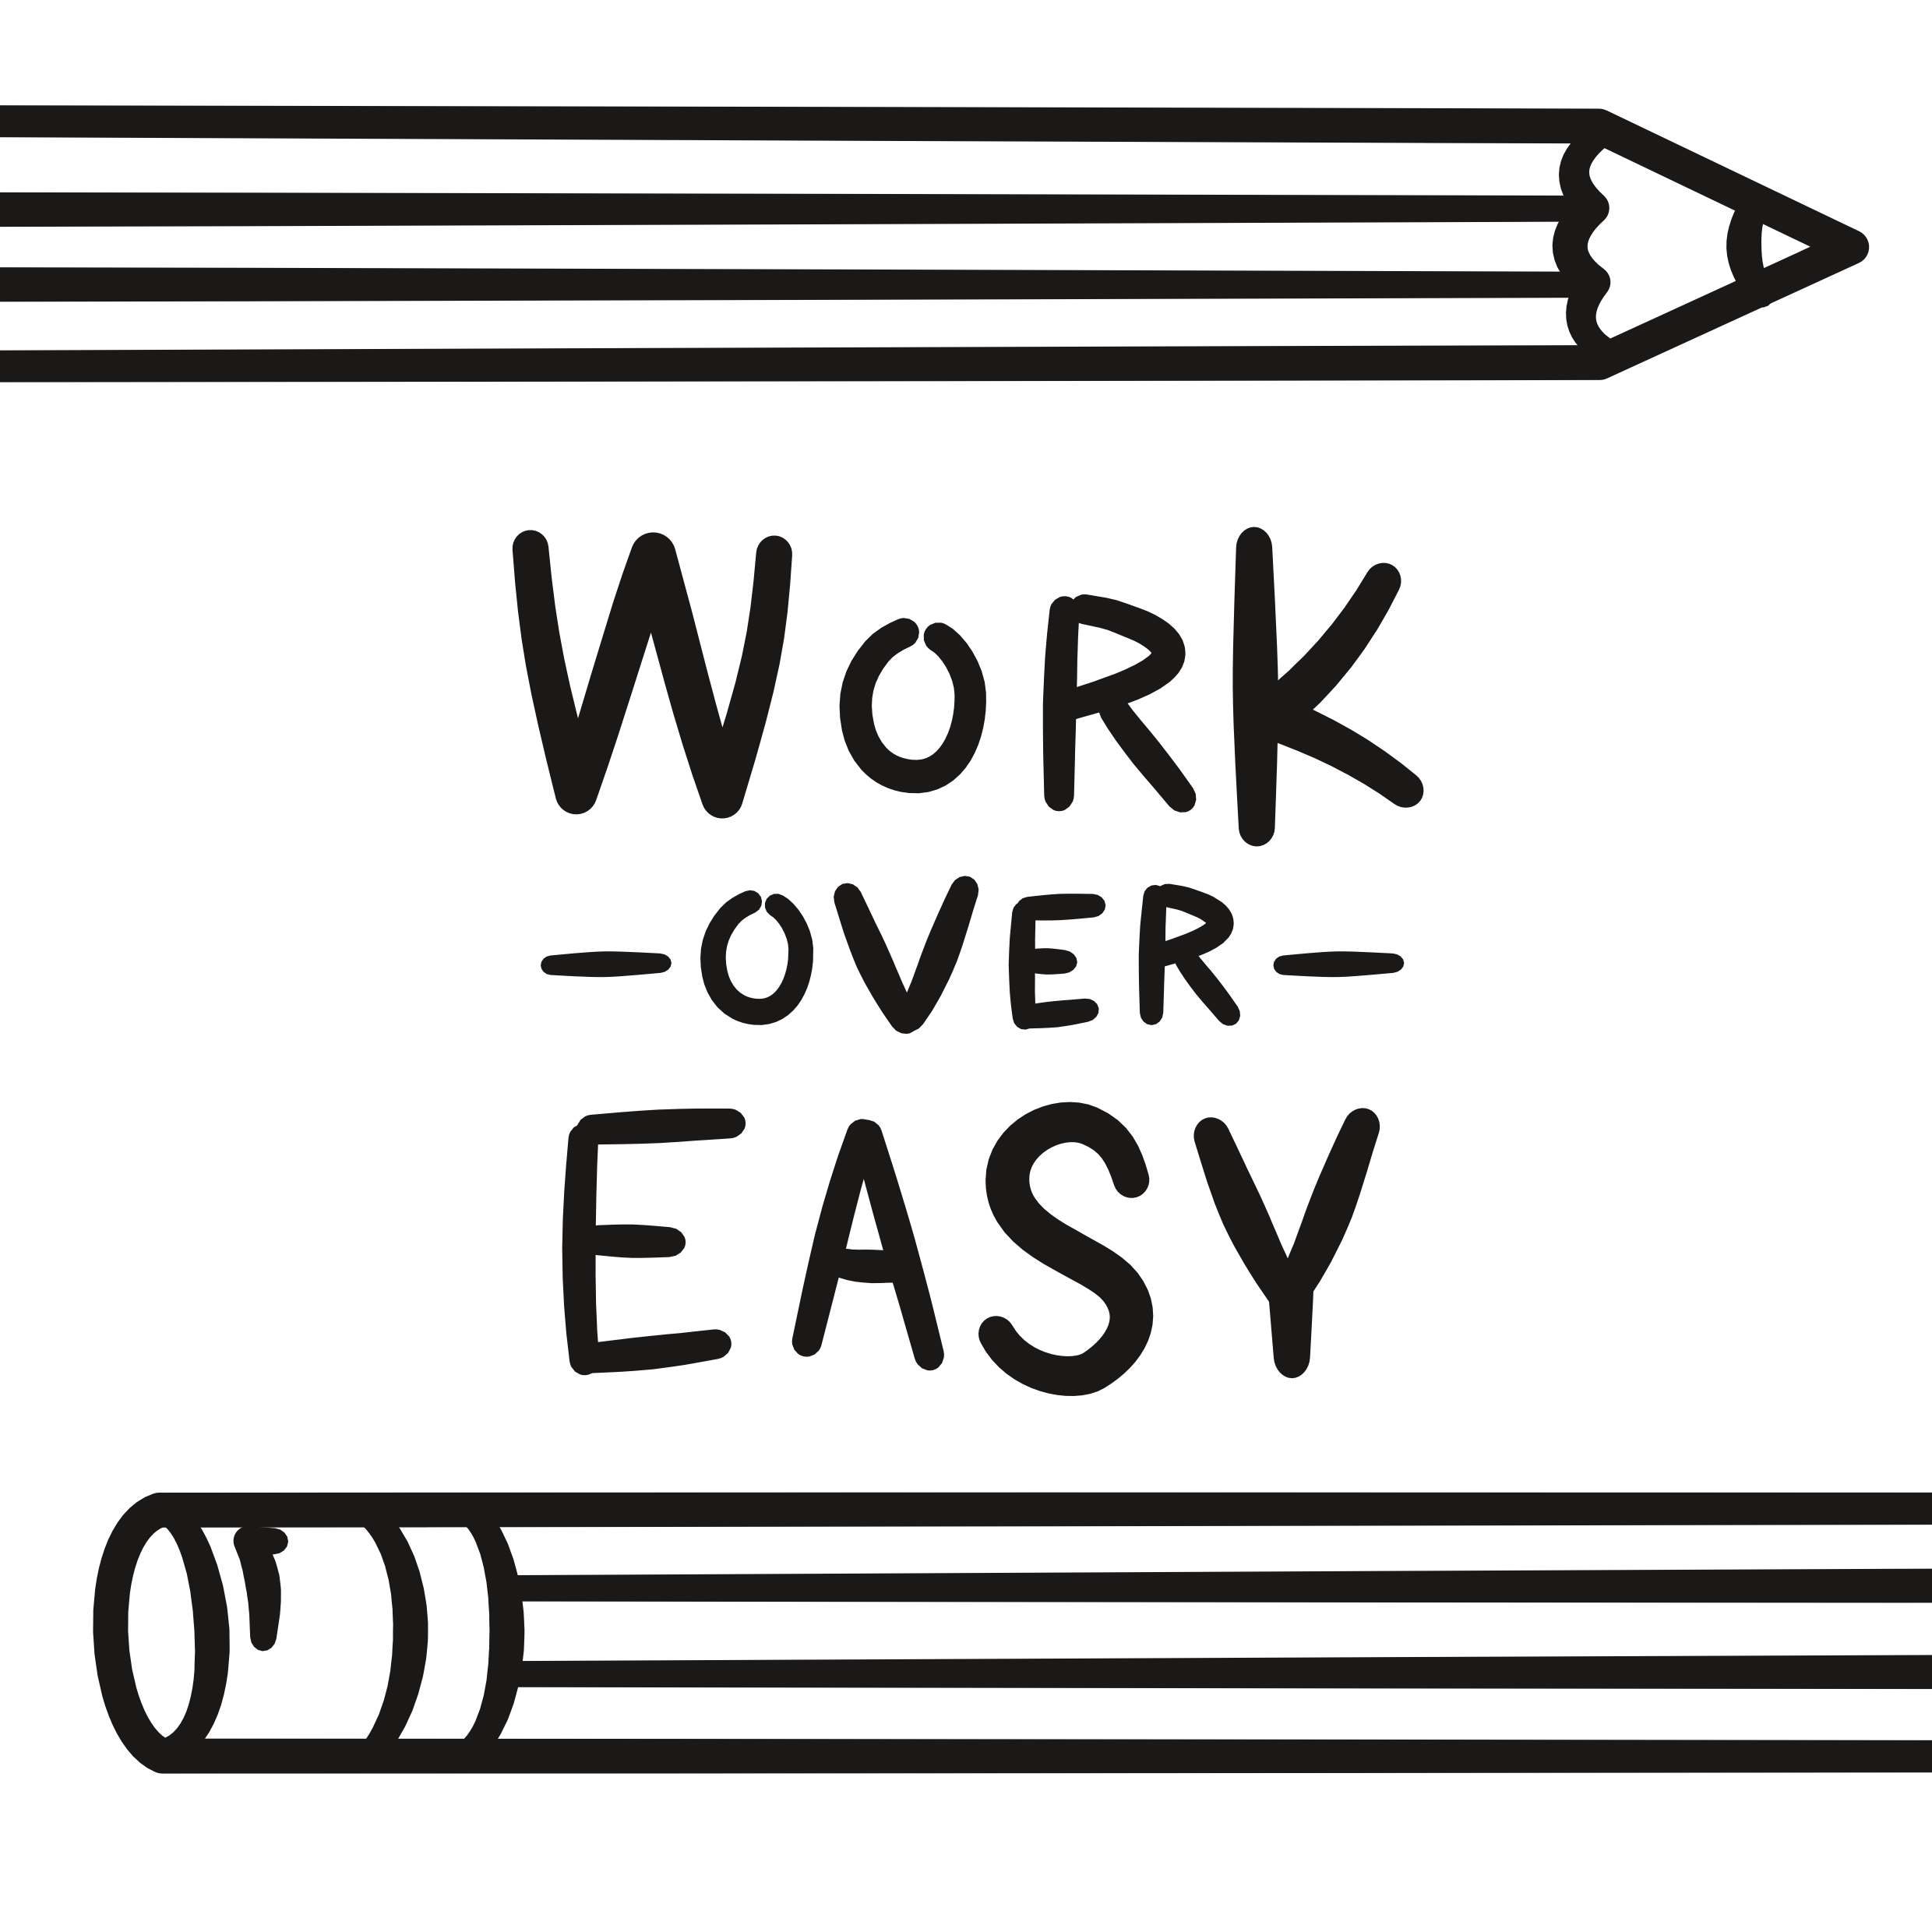
Sure there are moments when I look back at snapshots of that body in growth and I’m embarrassed. I’ve certainly outgrown what this blog was at its beginnings and the moniker I attached to it. Work over easy makes me cringe a little now.

That cringe isn’t why I’m stepping away after 5 years.

Growing this much, creating this much work, carrying this body around, has become exhausting. 

I know I’m not the only one feeling it. Everywhere I look people who have been putting work out into the internet, into the world, are burned out. Doing this consistently for so long is hard. 

I’ve slowly reduced my output and tried to focus on only making work I really love and I’ve made some things I’ve been thrilled by this year. But slowing down isn’t enough. 

I’ve known that since I started. I’ve toyed with stopping for years now. Every time I got close it felt like I was giving up, not moving on. I questioned what the point was if I could just give up this space. 

I never had a specific, overt aim when I started work over easy. But I’m sure I harboured some lingering fantasy that it would lead to some external success, that my work would take off, that it would lead to more prestigious platforms, that I’d get accolades and validation

That never happened. I’ve been fighting with the fact that it never will but that that doesn’t lessen what the process of making it has given me. I’d like to think that it’s brought something useful, or entertaining to the few people who’ve found themselves here over the years.

So this is it. There’s no big bang but hopefully a graceful step forward with my life which is so much more than this website.

While I say this is it, I know that it probably won’t be the end of me illustrating and writing for the web, or of me mediating and documenting my life online. I grew up online, here and in the neighbourhoods that came before. My portfolio will remain a touchstone between me here and there.

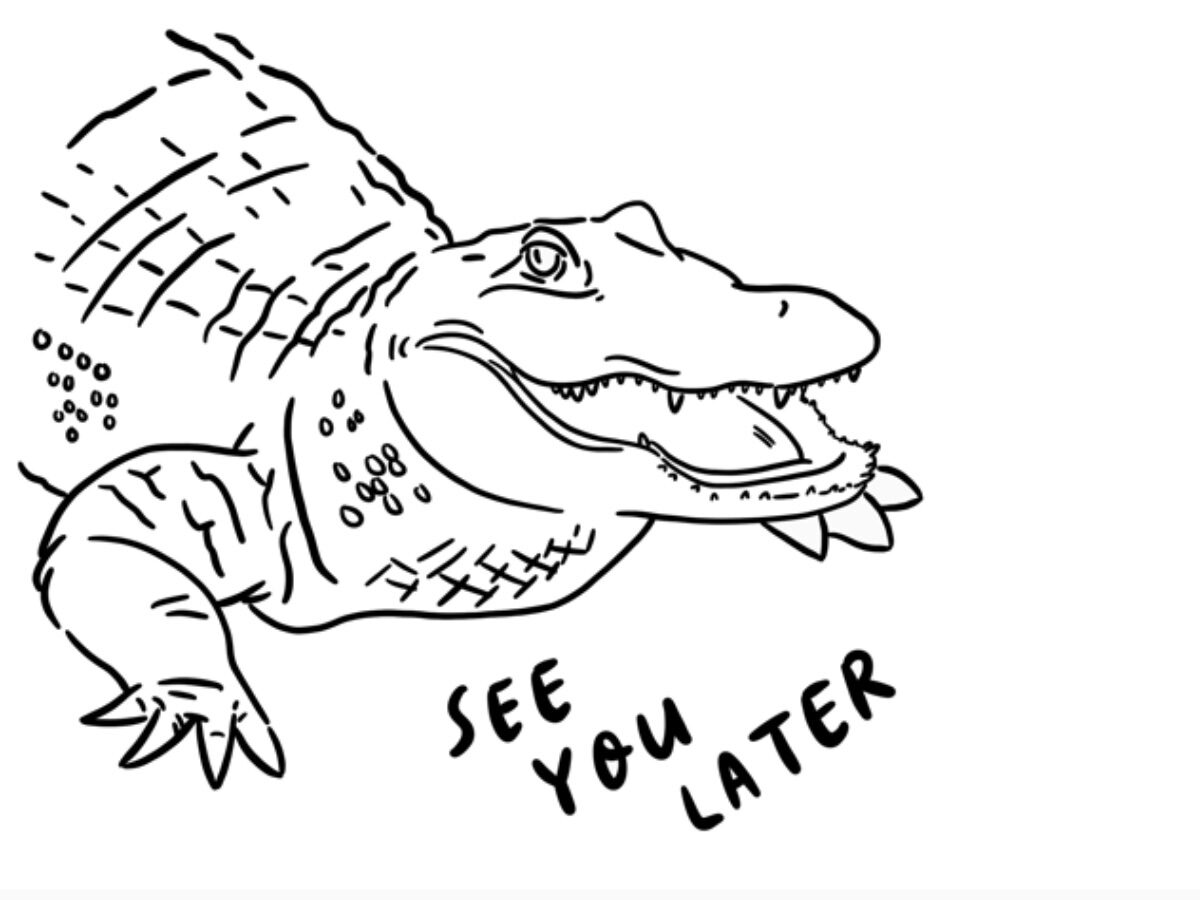
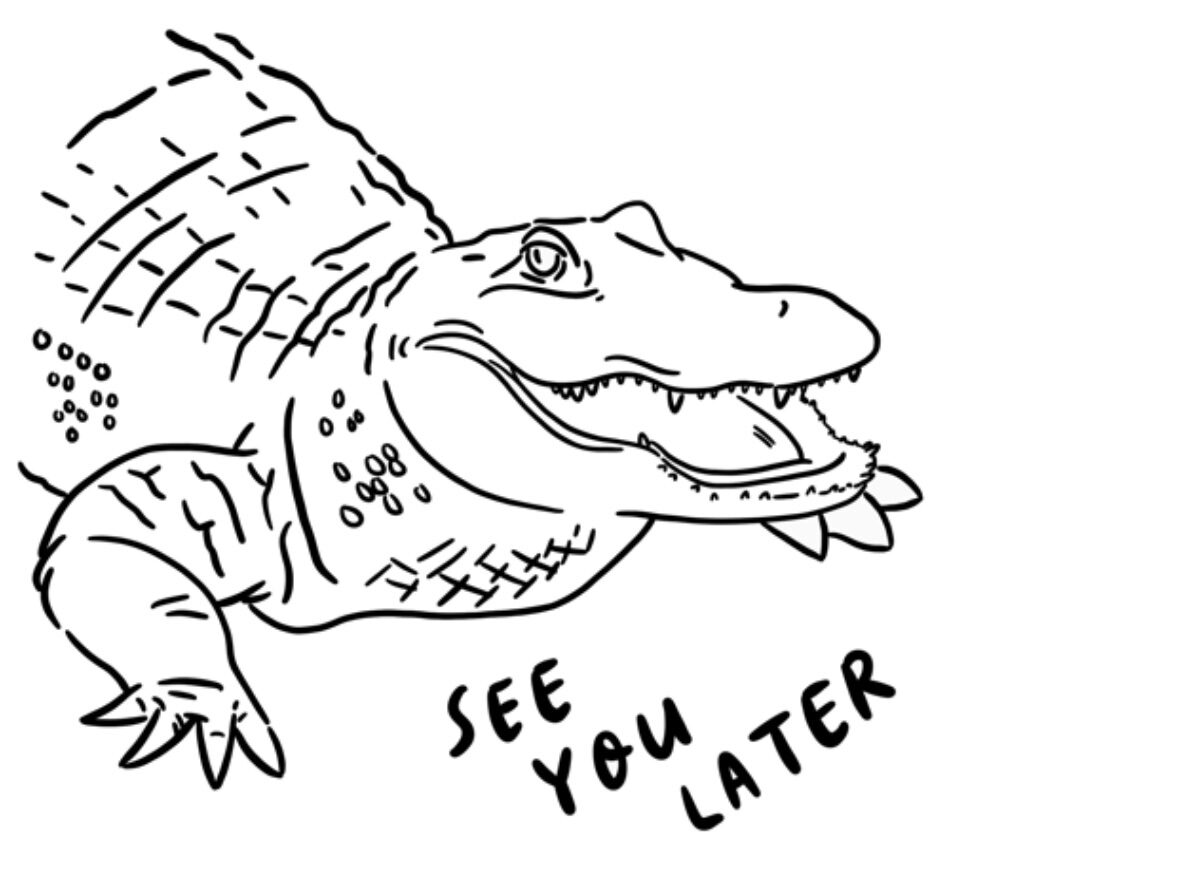
See you later alligators. 

Getting to draw as part of my research work always feels like a treat. Using visuals to tell a story, gather insights and share information is my happy place.

But it’s easy to forget to bring illustration into my research practice when the common standard is to focus facilitation and documentation around written work. So, I’ve put together a non-exhaustive list of ways that research can be visual. 

This list is here for me as a reminder and for anyone who works with me to inspire what you can ask for and expect from my design-led research practice.

Gif with the title how did it feel, it shows an illustration of a woman outlined with pencil scribbles to show different feelings like love and frustration
Illustrated cards to sort with short titles like "things you've written" and "photo evidence" they move between being laid out and grouped

Visual prompts in interviews

Illustrated facilitation tools are a great way to get participants engaged in interviews and workshops. These might take the form of anything from adding illustrations into card sorts, to getting participants to draw emotions as they tell you a story, to much more involved visual layouts to structure the discussion with whoever you’re speaking to.

Visual elements in surveys

Surveys can be pretty dull. Including illustrations can not only make surveys more interesting to fill out, they can also inspire different kinds of responses. Visuals can bring hard to verbalise feelings and ideas to life and visual responses to questions can challenge responder’s thinking.

Graphic recording and facilitation

My own personal notes are filled with visual and verbal recordings, because that’s how I think best. But shared graphic recording and facilitation takes that to another level. Visuals can anchor discussions and there’s an energy that comes along with people seeing their ideas be brought together on a page not just in word form. Illustration can also be democratising in group discussions relying less on quick reading and eloquence to get a point across and see it part of the whole.

Scene sketches and multimedia reportage

Inspired by the work of brilliant artists and reporters like Olivier Kugler, illustrated scenes from research can bring back what you’ve learned through interviews and ethnography in more immersive form. These might take the form of mixed media collages, featuring photos and notes or sketches of whole scenes to bring the worlds and contexts of the people you’ve spoken to to life for everyone else involved in the project.

A long winding yellow line is used like a time line to anchor the timeline of the development of the inclusive design workshops I've been running. Each entry has a small drawing.
This is the story of the inclusive design workshops we’ve been running at ENGINE Transformation

Illustrated journey mapping

Journey maps have been some of my favourite things to illustrate. Visual layouts effective hold narratives together while illustrated people, quotes and key take aways make journeys made by people through services feel human. 

Illustrated process diagram of how I onboard new illustration clients
This is how I onboard new illustration clients

Illustrated blueprints and process diagrams

Process diagrams and blueprints are necessarily visual but they can often feel cold, bringing in illustration, even if it’s just to put faces to swimlanes can make them easier to approach and more human. 

Illustrated portrait of a woman with the line "I want someone else to help me fo this. I'm so overwhelmed I don't know where to start and I don't trust myself to make the right decisions when there are so many rules"
Example of the kind of work I’ve been doing at HM Courts and Tribunals Service

Illustrated personas

I’m a big believer that smaller more emotive personas are the most useful. Illustration is a great way to bring your key insights to life and make them easy to share and remember. Where those bigger more comprehensive character study personas are required, hand drawn elements can break them up and stop them feeling as scientific (because they very rarely are) and more human.

Illustrated storyboard of me doing my taxes, or rather me failing because I can never ever find the right passwords!

Storyboards

Storyboards are a way of visually describing a sequence of events. Their graphic format works best to tell a story of a person’s journey through a service and offer a more emotive companion to service maps and process flows.

Visual cues and infographics

Sometimes research covers information that sits outside of a character or narrative format, that’s where infographics come in. At HM Courts and Tribunals Service, I did a lot of research into the different kinds of appeals, that information could be brought to life with imagery and made more accessible for stakeholders with a range of background knowledge through visual storytelling. This can work for huge bodies of knowledge, where big infographics and maps might be useful and tidbits you want to have reminders of like key quotes from people you’ve spoken to – a pepper mill drawing sat above my desk to act as a cue to remember words from one of our judges that started “consider the pepper pot…”

So those are some of the ways that my research work can be made visual and made better for being visual. Now to actually get to work and do more of this stuff!

I’ve been making things for The Browser, the world’s favourite curation newsletter and site, for at least 6 years now. They’re by far my longest running client. They’ve been a part of my illustration journey for so long now that I hadn’t actually stopped to think about how long we’ve been working together or quite how much we’ve made.

My work for The Browser started with making visuals for quotes they shared on their facebook page, back when facebook pages were key. These were a mix of collages and illustrations. We did that for a while. But it was really just a gateway into what we do now.

Some of my very first paid design work from back in 2015

I’m not quite sure when I was introduced to Cecily the giraffe, but we quickly became a team and almost all of my work with The Browser since has centered on Cecily. I’ve worked Cecily into banners, crosswords, countless illustrated scenes, and now they even have their own merch. 

We have worked on a few other projects over the years too. The Browser were the first company to ask me to draw them a set of staff portraits. Plus as they’ve grown to include more audio recommendations as well as articles, so has the cast of illustrated characters in The Browser family.

My work with The Browser has led to lots of other brilliant projects too either through people noticing my work there or recommendations. 

But we usually come back to Cecily, and I’m pretty happy about that. While my work with The Browser isn’t something that I share all that much, I have so much fun working out how to make Cecily a part of so many different universes whether that’s having to work out how a giraffe would ride a sled, what Cecily china patterns might look like or just having the chance to draw a dancing giraffe. They’re briefs I wouldn’t get from anyone else and would never think to try myself. It’s my longest running client relationship, but it’s still something that’s refreshing. 

As I was reflecting on all the work we’ve done together, I realised how much I’ve changed through that work and how much I’ve learned. So, here are some of the lessons I’ve taken away from working with the same company for over half a decade.

Don’t let getting comfortable become a rut

I had been drawing Cecily with their eyes closed for years, because that’s just how they looked. It was their blue steel. It wasn’t until I was prompted, that I attempted to draw them with their eyes open. I kind of loved it. It was magnum. It’s easy to slip into a way of doing things that feel comfortable when you’ve been doing a job for a long time, but don’t be afraid to take on suggestions and try something new.

Make new projects work for you and your client

When you work with someone or a team for a long period of time you build trust and that trust can give you freedom. I was only just starting to refer to myself as an illustrator when I took Cecily by the hoof and I was given the task of drawing a world for them. If there’s a new way of working or something you want to do more of, your trusted clients are the people to suggest them to and try them out with because giving you room to grow together is great for you both. 

New clients aren’t always the most important clients

Work for new clients always feels urgent. You want to make a good first impression. There’s a rush of excitement and nerves. But that shouldn’t come at the expense of those longer term relationships. As I said earlier, the work I’ve done for The Browser has often led to those new clients and it’s good work to do. I’ve asked to push back work for other clients so that I can prioritise The Browser (and vice versa) because they’re equally important. I think clear communication is the foundation of that. You have to do what you say you will by the date you said you’d do it, and every now and then you need to throw in a little razzle dazzle. 

Keep finding the joy

I think 6 years of drawing the same giraffe could easily have become boring. There are certainly moments where I get deja vu. But you have to actively look for the fun. I love a good pun or sneaking something silly into an image to keep it interesting for me while I’m working, like having Cecily make a giraffe snow-giraffe rather than a snowman in our latest winter series. I can and will draw a silly hat on anything. 

If you want to see more of Cecily and get some delightful reading recommendations sent to your inbox, The Browser really is brilliant.

As London, very slowly, reopens I wanted to give a virtual tour of one of my favourite areas to share a glimpse with those who can’t visit and a few fun facts to make a visit more fun for those who can.

King’s Cross station has been a comforting presence in the city for me since I moved. It’s the station you arrive at if you’ve come from my hometown York so it’s the place I was most familiar with when the city felt unending in scale and scaries. It’s the spot that my mental map of London folds out from. 

After five years in the city, I’ve spent plenty more time in and out of the station, visiting home and heading out for work. The more time I’ve spent there, the more I’ve explored and so this virtual tour (thankfully) goes beyond the station walls. It’s been a joy to run/jog to when I’m looking to push myself and I’m sure it will become a regular haunt again when commuting and travel become a little more common. I’m grateful it’s one of the few places I’d head to feel grounded, despite being a place of transition. While I’m not promising to share anything too far off the beaten track, I did love mapping and trying to bring some life to one of my favourite places.

As I did my research for my map I came across so many other fun facts that it would have been rude not to share, so here’s a bonus infographic you can use as a bit of a scavenger hunt if you’re ever in the station or need to impress a friendly tourist.

A lot of the client illustration work I’ve done this year has been for Lenny’s newsletter, which is “a weekly advice column about product, growth, working with humans, and anything else that stresses you out at the office” with over 65,000 subscribers by Lenny Rachitsky. It’s been a lot of fun to work on.

I worked on a new illustrated brand for the newsletter, which you can read about in a little case study I wrote for my portfolio. But I wanted to share a little bit more about my favourite thing we’ve been working on together, illustrated infographics.

These images really hit the sweet spot of work I want to be making right now they use visual structure to making information more engaging and accessible. I think they also bring something fresh to Lenny’s already brilliant newsletter. 

So how do we make them?

I say we, because while I do the illustration and visual elements, they’re a real collaborative effort.

Each one starts with its own brief that usually covers an outline of the content that the visual should cover. The infographic I made to go with the habits of successful product managers had an idea of a title, that there were going to be ten habits and a rough list of what those ten would be. 

With that brief in hand, the first thing I do is develop the structure for the image. These layouts have definitely become a bigger part of the image and better as we’ve made more. The first one I made was just a grid, but more recent infographics have really used their structure to convey elements of the content, like the clipboard for the jobs of a product manager image which really added to the feeling of someone going through their own work checklist.

Then I go back to the brief and start to brainstorm ideas of how I can bring the content to life. I’m always aiming for something that’s easy to understand but a little bit figurative rather than purely literal. This stage is usually in a notebook and just words or descriptions of ideas rather than thumbnails. Even though I usually think visually, I find my brain is usually moving a lot faster than my hands at this point!

Depending on how much time we have, I’ll try to share these ideas to make sure they’re on the right track and if they’re not get some feedback so I can pivot quicky.

Next up it’s line work. The brand style we developed is based around loose inky lines and watercolour textures. So I’m always referring back to that as I sketch. 

While I draw in procreate, everything really comes together in Figma. I have to admit this is really the first time I’ve used Figma, so I’m sure I’m only using a tenth of its capacity. But it’s been a brilliant tool for collaboratively combining text and images. I was really taken aback by how easy it is to use!

When the text and images are starting to work together, I’ll make any necessary tweaks to the illustrations then add colour. Often when we put the text in I find images have to shift a little bit to make the text as readable and easy to layout as possible.  I’m not typically a hue colour person (as you may have guessed from seeing pretty much all of my work on this blog) but working with the palette we defined at the branding stage and getting to play with tone within that structure has made it really fun. I love how you can use light and dark to draw the eye across the infographic.

With all of the final elements together, it’s ready to go out as part of Lenny’s newsletter and be shared across social media. 

It’s been wonderful to see the illustrations and infographics embraced by the same community that inspired the initial campfire branding. The infographics have been shared far and wide and even made it into that coveted digital real estate spot of the desktop background.